
Tracking social media metrics comes down to using real data to evaluate the impact of your social presence on the outcome of marketing campaigns and, ultimately, revenue. It helps you see how effective your social media marketing efforts are and where you can make improvements.
While social media metrics are important, it can be difficult to figure out which metrics really matter for your business.
That’s why we’ve compiled a list of 18 important metrics and how to track them. These metrics give you insights into your brand visibility, audience behavior, and conversions, and will help you make more data-driven marketing decisions in the future.


Let’s dive in.
Breaking down the social media funnel
Before outlining the most meaningful social media metrics, let’s break down the social media funnel to see where each metric belongs.
A typical social media funnel is divided into four major customer journey stages:
- Awareness stage: Metrics in this segment show your existing and potential audience.
- Engagement stage: Metrics in this stage show how your audience interacts with your posts.
- Conversion stage: Metrics in this stage show how effective your social engagement is.
- Consumer stage: Metrics in this stage demonstrate what active customers feel about your business.
Each stage of the social media funnel has its own set of metrics and KPIs that show you the impact of social media marketing on business growth.
Social media metrics: Awareness
These metrics reflect your existing and potential audience.
Brand awareness
Brand Awareness is the attention your business gets across all social media platforms per reporting period.
Brand awareness can be indicated through a variety of metrics, including impressions, shares, mentions, and links. Reporting periods also differ. Some last a week, others last a month, and it can last up to a quarter.
How to track it
- Decide which attention metric(s) you want to measure to show your brand awareness.
- Select the reporting period you want to use for your brand.
- Use a brand monitoring tool to track all the times someone mentions your brand on social media, with or without an @.
Audience growth rate
Audience growth rate refers to how quickly your brand gains (or loses) followers per social media channel.
As more people sign up to social media platforms, brands will also gain more followers.
But you shouldn’t ask yourself, “How many new followers did we gain last month?” Instead, think about how fast you gained last month’s followers, and if you gained them faster than your competitors.
How to track it
- Calculate your net new followers on all your platforms over your reporting period.
- Divide your new followers by your total followers (on each platform) and multiply by 100.
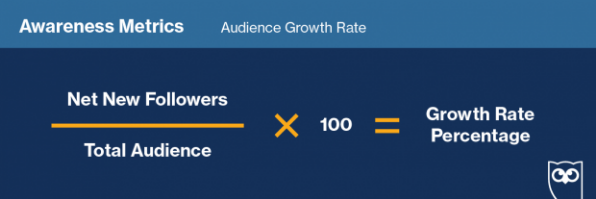

Say your brand’s Facebook account has 10,000 followers in June (end of Q2). For Q2, you need to measure your audience growth rate from July 1st to September 31st. If by September 31st, you have 12,546 followers, then your audience growth rate for Q3 is 25.46% (approx.)
Note: You can track your competitors’ AGC the same way.
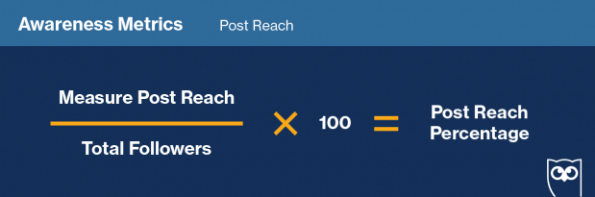
Post reach
Post reach refers to the number of people who have seen your post since it went live (even if they see it multiple times).
For instance,if you have 1,000 followers and each of them sees your post three times, your reach is still only 1,000.
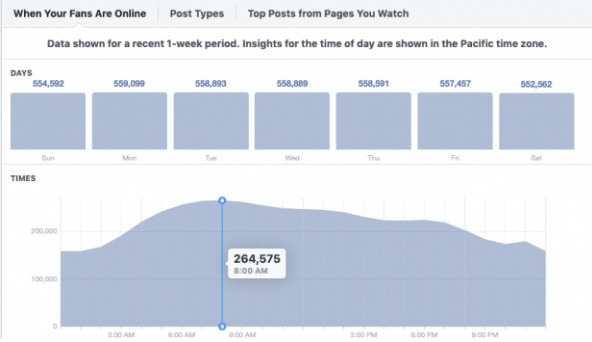
This metric is directly affected by the timing (i.e. when your audience is online) and your content (i.e. the kind of posts your audience loves).
How to track it
- Measure the reach of a particule post.
- Divide the reach by your total number of followers. Then, multiply it by 100 to get your post reach percentage.

Note: Facebook has a “When Your Fans Are Online” feature that will show you the best time to post. Posting at those times can increase your reach.

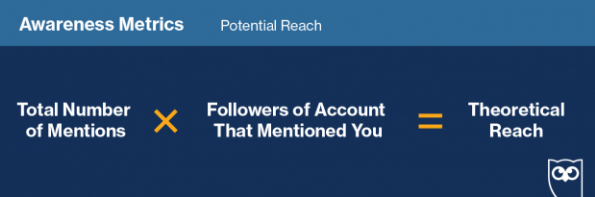
Potential reach
Potential reach is the number of people who have the opportunity to see a post during a period of time.
For instance, if one of your followers shared your post with their network, between 2-5% of their followers will also make up the post’s potential reach.
This metric is important to measure because you, as a social marketer, should always try to increase your audience. Knowing your potential reach will help you measure your progress.
How to track it
- Use a brand monitoring tool to track your brand mentions.
- Calculate the number of followers of the account(s) that mentioned your brand.
- Multiply those two numbers together to get your Theoretical Reach–which is the maximum number of people who could, theoretically, see your brand mentions.
Your potential reach is about 2-5% of your actual reach.
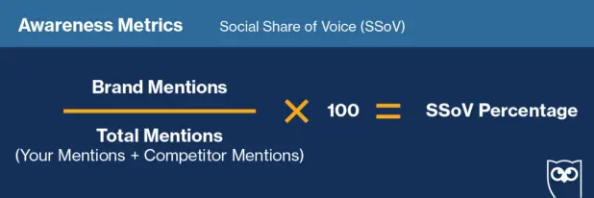
Social share of voice
Social share of voice (SSoV) measures how many people mentioned your brand on social media compared to your competitors.
There are two kinds of SSoVs:
- Direct – tagging your posts (e.g., @AdEspresso)
- Indirect – mentioning your brand without a tag (e.g. “adespresso”)
Basically, SSoV measures how visible and relevant your brand is in the market. Knowing this metric will help you decide whether you should update your social media strategy or not.
How to track it
- Measure all the mentions your brand gets (both direct and indirect) across all your social platforms.
- Measure your competitors’ mentions during the same period of time.
- Add your mentions to your competitors’ mentions to get the total industry mentions.
- Divide your brand mentions by the total industry mentions and multiply by 100 to get SSoV percentage.

Note: To make this process easier, use social media analytics tools.
Social media metrics: Engagement
These metrics show how people interact with your content.
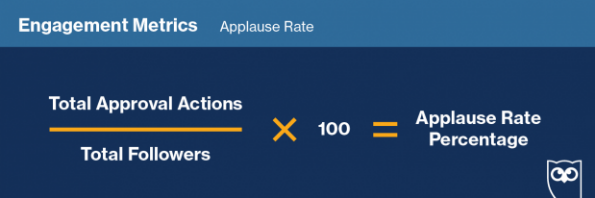
Applause rate
Applause rate denotes the number of approval actions (or “applause”) a given post gets relative to your total number of followers. These actions include likes, favorites, thumbs-ups, etc.
When a follower applauds your post, they’re acknowledging its value to them. Knowing the percentage of people who find value in your content can help you know what sort of posts you should make.
How to track it
- Add the total approval actions a post got during a reporting period.
- Divide that number by your total followers. Multiply by 100 to get your applause rate percentage.

Note: Track approval actions with a social media impact tool to ease the process.
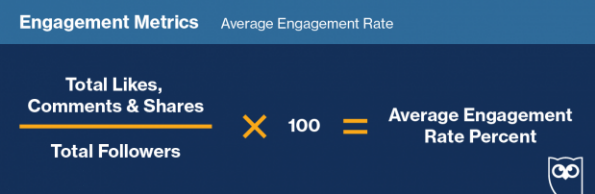
Average engagement rate
Average engagement rate is the percentage of your entire audience that has interacted with your content during a reporting period.
This metric is important because higher engagement means that your audience loves your content. To know for sure, track the engagement rate of each of your posts. If the rate is high, the actual number of likes, shares, and comments is irrelevant.
How to track it
- Add your post’s total likes, comments, and shares.
- Divide the number by your number of followers and multiply by 100 to get your average engagement rate.

Note: The benchmark for this metric is different on every social platform.
For example, Facebook and Twitter have lower engagement rates (0.5% to 1%). But Instagram has relatively high engagement rates (3% to 6%).
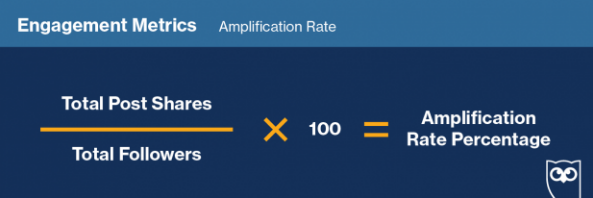
Amplification rate
Amplification Rate is the number of shares you get on average for each post. The term was coined by Avinash Kaushik, the Digital marketing evangelist at Google, who defined it as “the rate at which your followers take your content and share it through their networks.”
The higher your amplification rate, the more willing your audience is to associate themselves with your business.
Depending on the social networks you use, you might base your amplification rate on metrics like Twitter retweets, LinkedIn shares, Pinterest repins, etc.
How to track it
- Add the number of times your post was shared (e.g. retweets, shares on Instagram, repins, and shares) during a reporting period.
- Divide that number by the total number of followers you have and multiply by 100 to get your amplification rate percentage.

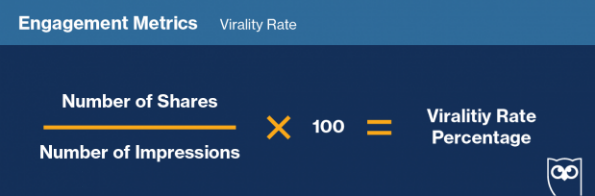
Virality rate
Virality rate is the ratio of people who shared your post to the number of impressions the post had during a reporting period.
Virality rate goes deeper than just likes and shares. For instance, a post that gets 30,000 likes may only get 0.2%, while another post that receives 5,000 likes gets 8.94% virality. In this case, the latter post is actually doing better than the former one.
How to track it
- Calculate your post’s impressions.
- Calculate your post’s shares.
- Divide the number of shares by the number of impressions. Multiply by 100 to get your virality rate percentage.

Social media metrics: Conversion
These metrics show how effective your social engagement is.
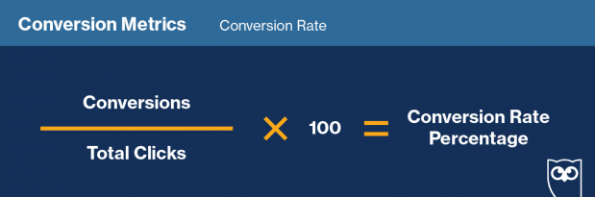
Conversion rate
Conversion rate refers to the ratio of users who take a desired action on a page after clicking on a link in your post to the page’s total visitors.
These actions can be to download gated content, subscribe to a newsletter, register for a webinar, etc.
A high conversion rate indicates that your audience finds your content valuable. On social media, it means that your post matched the offer you made.
How to track it
- Make a post with a call-to-action (CTA) link. You can use a URL shortener to track the link.
- Place a “cookie” on the user’s device. This attaches the lead to the campaign.
- Use the campaign reports to track the total number of clicks and conversions the post generated.
- Divide the conversions by the total number of clicks and multiply by 100 to get your conversion rate percentage.
Note: Traffic and conversion rates are mutually exclusive. The conversion rate of a post can be high even if traffic is low.
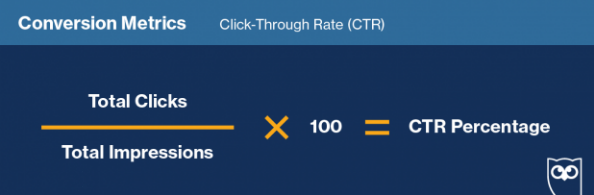
Click-through rate
Click-through rate (CTR) refers to how often our audience clicks on the CTA link in a post.
This metric should not be confused with engagement actions like likes and comments. A CTR is specifically tied to a link that takes people to a different page than the social platform they’re on.
Tracking your CTR often will give you invaluable insights into how compelling and relevant your offer is to your audience. A low CTR means that your audience isn’t resonating with your offers and vice versa.
How to track it
- Measure the total number of clicks on a post’s link.
- Measure the total impressions that post had.
- Divide the number of clicks by the number of impressions and multiply by 100 to get your CTR percentage.

Note: Track your clicks and impressions within the same reporting period.
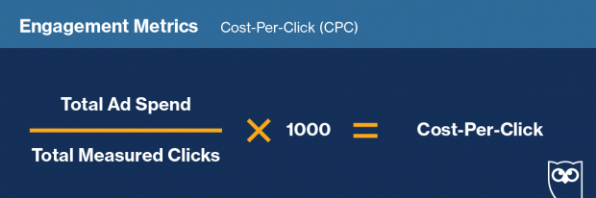
Cost-per-click (CPC)
Cost-per-click (CPC) is the amount of money you pay per individual click on your sponsored post.
When advertising on social networks like Facebook, Twitter, Instagram or LinkedIn, don’t focus on the total amount you spent. Instead, pay attention to your CPC. It will help you determine if your investment is yielding good returns or not.
How to track it
- Calculate the total costs of your social media campaign.
- Divide your total costs by the number of conversions you got.
For instance, if you spend $2,000 and get four conversions, your CPC is $500. If your profit is $350, you can safely say that your investment is not yielding good ROI.
Note: You can also get your CPC from your platform’s Ad Manager. Make sure to check the Ad Manager often.

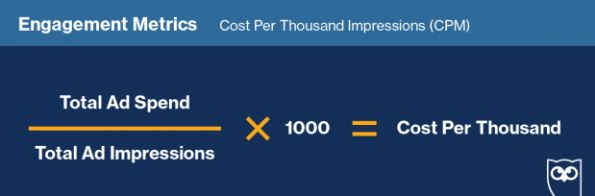
Cost per thousand impressions (CPM)
Cost per thousand impressions (CPM) is the amount of money you pay every time a thousand people scroll past your sponsored post.
As opposed to a CPC campaign, a CPM post doesn’t really drive action. It only creates views and impressions. So if you want to split test your content, CPM is a faster and cheaper way to do it.
How to track it
You can also track your CPM in your platform’s Ad Manager. Check it often and ensure that you don’t leave your CPM campaigns unattended for a long period of time.
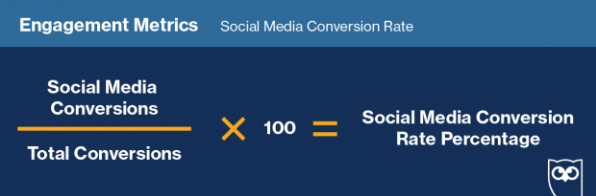
Social media conversion rate
Social media conversion rate is the percentage of total conversions that you get from social media.
Tracking this metric will give you valuable insights into how effective each post is in your social media campaign. It tells you how well your offer(s) resonates with your target audience.
How to track it
- Use an online URL shortener to make your CTA link trackable.
- Identify the total number of conversions you have.
- Divide your social media conversions by your total conversions and multiply by 100 to get your social media conversion rate.

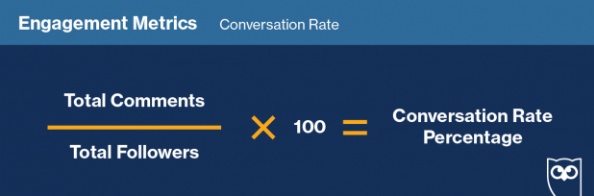
Conversation rate
Conversation rate refers to the ratio of comments per social media post to the number of total followers you have.
This metric was also coined by Google’s Avinash Kaushik, and it helps you track comments with context. I mean, getting an average of 15 comments per post is exceptional if you have only 150 followers.
Knowing your conversation rate will help you understand whether your social media posts are interesting enough to spark a conversion, which is the core of any social network.
How to track it
- Use a tool like Hootsuite Analytics to get the number of comments on your posts during a reporting period.
- Divide the number of comments by the total number of followers you have and multiply by 100 to get your conversation rate percentage.

Social media metrics: Social customer service
These metrics show you what your active customers feel about your business.
Customer testimonials
Customer testimonials refer to any positive or negative comment, review, assessment, or endorsement a customer gives about your brand.
If your customers are happy with your brand and offer(s), they’ll be more likely to share their positive experience with others.
A constant stream of genuine testimonials on social media will build credibility and trust amongst your followers, while boosting your brand’s visibility.
Here are some ways to get more customer testimonials:
- Directly ask your best customers to leave a review of your service. Don’t offer to compensate them, though, because that would dilute your credibility.
- Run a social media campaign that urges customers to give written, online, or video testimonials about your product or service.
- To simplify the process of leaving testimonials for your customers, put a link to your Google My Business review form in your posts or social media bio.
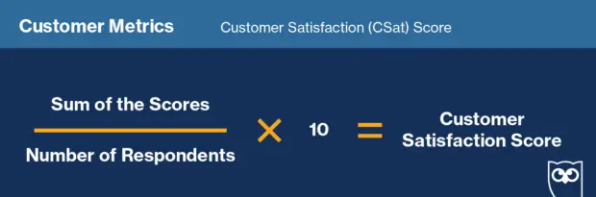
Customer satisfaction score (CSAT)
Customer satisfaction (CSAT) is a metric that tells you how happy customers are with your product or service.
Typically, the CSat score is determined by one simple question: How would you rate your overall satisfaction with this product or service?
You ask customers to rate their satisfaction on a scale of 1 to 10 or sentimentally (Poor, Fair, Good, Great, Excellent). This scale is clear and easy to answer, especially on social media.
How to track it
- Create a CSat survey on social media.
- Add up all the score numbers.
- Divide the sum by the number of respondents and multiply by 10 to get your customer satisfaction score.

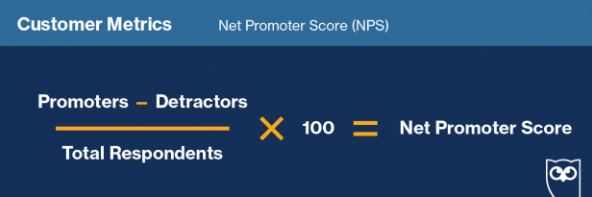
Net promoter score
Net promoter score (NPS) is a metric that measures how loyal your customers are to your brand.
Unlike CSat, you can use NPS to predict how customers will engage with your product in the future. All you need to do is ask this question: How likely are you to recommend our [brand/product/service] to a friend?
Then, you ask customers to answer the question on a scale of 0 to 10. Based on their answers, you group the respondents into one of three categories:
Detractors: 0 – 6
Passives: 7 – 8
Promoters: 9 – 10
The unique thing about NPS is that it measures customer satisfaction and future engagement, which is why it is so valuable for businesses of all sizes.
How to track it
- Create an NPS survey on social media.
- Subtract the number of detractors from the number of promoters
- Divide that number by the total number of respondents and multiply by 100 to get your NPS.

While vanity metrics are easily accessible, they don’t really impact your business growth. The metrics outlined above, however, let you measure data that actually influences the results of your marketing efforts.
You’ll have to work harder to get these numbers, but you’ll get more returns than the effort you put in.
Social media metric reporting tool
Hootsuite Analytics
With Hootsuite Analytics, you can track your social media performance across all platforms from one interactive dashboard. You can see what works well for your business and what you can improve on.