One of the more straightforward Facebook ad metrics commonly used is Facebook cost per engagement. However, just because it’s simple to calculate doesn’t mean it’s necessarily the most effective one for assessing your ad spend.
This article explains the Facebook cost per engagement metric. We’ll cover what it is, when it sometimes isn’t enough, and look at alternative metrics in your ad manager you could use instead to measure your advertising campaign objectives.
What is Facebook cost per engagement?
Facebook cost per engagement is a dollar-value metric that shows your expenditure for each user interaction on one of your adverts.
When you launch an advertisement, the target audience can engage with your ad in a variety of ways…
- Comments on Page Posts
- Link clicks
- Page Likes
- Page Photo Views
- Page Post Likes
- Page Post Shares
The Facebook cost per engagement metric is useful for understanding that users are taking notice of your ads. But, at best, it’s a headline metric― because it combines a range of actions users take with your advert.
Consequently, It will depend on the purpose of your campaign as to whether it provides real insight.
How to calculate Facebook cost per engagement
Calculating cost-per-engagement is simple. Divide the total ad cost of your campaign by the total number of engagement actions with an ad.

Where to Find Cost-Per-Engagement Stats in Your Facebook Ad Dashboard
In the example above, the total campaign spend was $54.33, and the total number of engagement actions was 51. So the cost per engagement was $1.07 (54.33/51 = 1.07).
Knowing the cost-per-engagement is essential for a branding/educational campaign objective. But you need to dig deeper into your metrics if you’re running a lead generation or sales campaign.
Facebook cost per engagement is sometimes called Cost Per Action (CPA) on other advertising platforms.
Facebook likely calls it cost per engagement to reduce confusion with the financial acronym of CPA, which in a marketing use case refers to cost per acquisition ―the price of landing a new customer.
What is the average cost per engagement on Facebook?
Understanding the average cost of user engagement isn’t the most helpful metric to use because it will depend on your Facebook advertising campaign’s precise aim.
Let’s say your campaign aims to encourage page shares to build brand awareness. In this situation, why would you care about the link click engagement element?
You can use more focused engagement metrics to quantify your Facebook advertising cost, which provides a clearer picture.
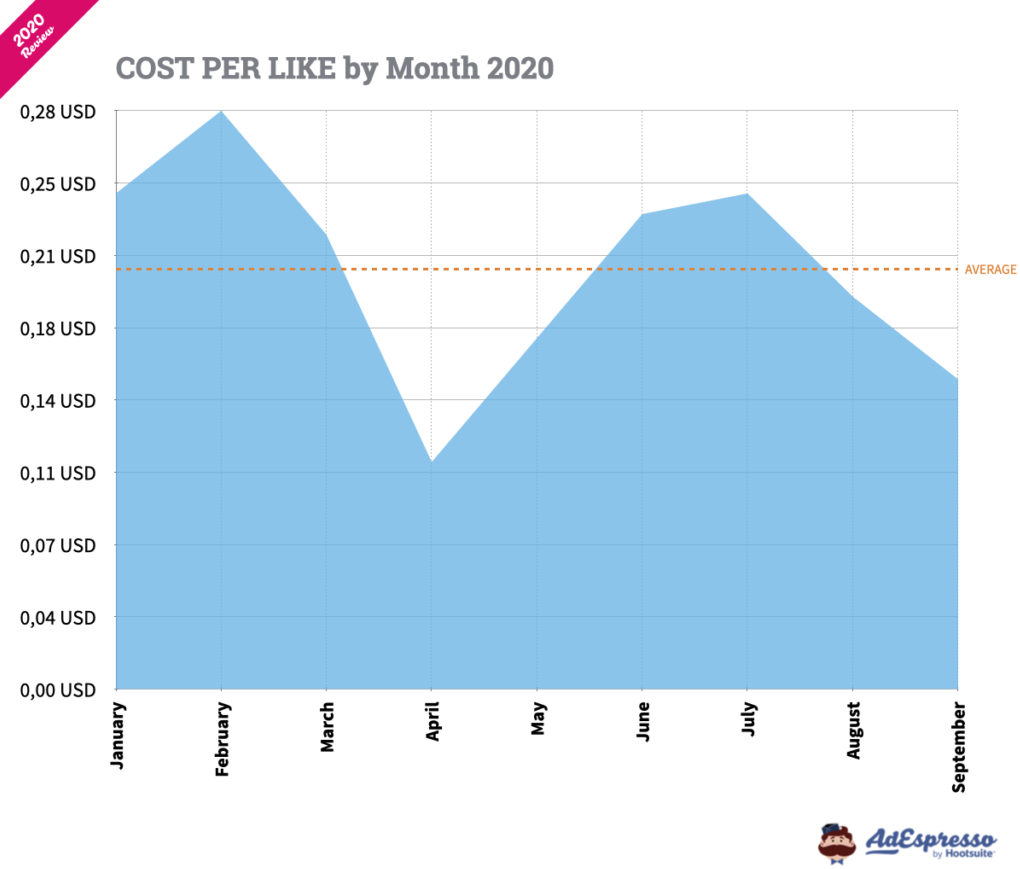
Here’s a specific example. If you ran an outreach campaign intending to get likes on a page, AdEspresso found that the average cost-per-like for 2020 was a sliver under $0.21.
If you set out to track a distinct engagement action with a target audience, you can optimize your content and make better use of your ad budget.
You will likely find the overall cost per engagement metric usefulness increases only after building up your own campaign track record. When you build up a track record of Facebook advertising, you can use it to benchmark how each of your campaigns performs. Only then can you decide if you are paying too much for a user’s engagement.
How does your Facebook advertising cost stack up against the benchmark? Find out on our Facebook advertising metric benchmarks page, updated regularly with new data.
Why tracking Facebook cost per engagement isn’t enough
Facebook naturally wants its users to spend as much time as possible on the platform, interacting with content, and viewing multiple adverts. For Facebook, engagement is the lifeblood of the platform.
But just because Facebook values user engagement, it doesn’t mean that you should rely on the metric as well. Views, comments, likes, and shares are all desirable, but do they inform you about your campaign’s real goals, or are they a vanity metric?
Yes, it can be reaffirming that your adverts are being seen and interacted with. But, interaction is only a small part of a much larger picture when evaluating an advert’s performance.
You should seek out more informative metrics to paint a clearer picture of your return on advertising spend. Some revealing metrics you could focus on instead are―
- Specific engagement metrics, like link clicks and page shares.
- How many leads has the campaign produced?
- What’s your average conversion rate?
- The average number of times an individual has seen your ad (vital for awareness campaigns)
- The number of unique users who’ve seen your advert (audience reach).
It will frequently be a combination of several metrics measured against your campaign objectives that provide actionable insight — helping you optimize your campaign ROI and giving you more data to create better ads in the future.
Metrics to track beyond Facebook cost per engagement
There’s a bucketful of Facebook advertising campaign metrics that can be more informative. For now, we’ll take a look at two of the more commonly used ones, Cost per Click and Cost per Lead.
Cost per click
The cost-per-click (CPC) metric is as it sounds ― how much has each user’s click on the link to your landing page cost you? (Don’t confuse it with the number of times your ad is clicked.)
Let’s return to our screenshot―

You can calculate your cost-per-click by looking at the total number of link clicks under Total Actions (in the above example, it’d be 11 Link Clicks) or by looking at the number of unique visitors from this ad campaign in Google Analytics.
(If you’re not sure how to track your Facebook ads in Google Analytics, check out our blog post with step-by-step instructions). Often, Google Analytics can provide more informative data than using the Facebook pixel alone.
In the case of this particular campaign, the cost-per-click at this time would be $4.94 ($54.33 total spend/11 clicks=$4.94).
Cost per lead
The central purpose of many advertising campaigns is to win new customers. For those selling low-cost goods, an ad campaign can be measured by the number of sales it generates using some simple cost-benefit math.
But others selling services and other high-cost items will use a Facebook campaign to add fresh leads to the top of their sales funnel. You can determine this metric in combination with Google Analytics.
For example, when I log into Google Analytics, I can report that this campaign’s conversion rate is currently 11%, which means we’ve had one visitor turn into a lead. Since the total spend so far is $54.33, the cost-per-lead so far is $54.33.
If you don’t want to have to calculate these numbers yourself for every campaign you run, the AdEspresso Facebook ads manager can do it for you and present the data in a neat little dashboard:

Making sense of your Facebook Advertising Metrics
Advertising is all about results. So you need to consider how your metrics stack up against the desired outcome of any social media campaign.
Knowing your cost-per-click and cost-per-lead or cost-per-conversion metrics is really important and will help you see if you’re spending too much on the campaign or not. After all, if you spend too much money to acquire a lead, you may still lose out in the long run.
For example, if you calculate your numbers and you see your cost-per-lead is $20.00. But if your product costs $5.00 and people usually only buy from you one-time, you have three options: figure out how to get your cost-per-lead down (this can generally be done through Facebook ad campaign testing), figure out how to increase your average order value, or figure out how to increase the average lifetime value of a customer.
Do you know what your cost-per-click and cost-per-lead are for your campaigns right now? If not, break out your calculator or sign up for a FREE AdEspresso account today and start gaining insight into your ad spend!
If an ad has been served to 25,640 people at a total cost of $735.49 does that mean I am paying $28.68 per 1000 impressions? If i optimise for even the maximum bid of $1.97 am I not hugely better off?
It depends if the 25,640 figure refer to unique users or to impressions. If it’s the campaign reach, likely those 25,640 users have seen your ads more than once so the CPM might be lower. Overall I’d suggest you not to think in terms of CPM, what really matters is the ROI. How much are you spending for a conversion? Is that worth it or not?
You can also analyze your campaign and have a better overview of it with our free tool for Facebook Ads Reporting
As Massimo already mentioned to look at your cost per conversion as that what at the end matters that how profitable it was. Considering 25,640 Impression costing $735.49 is too high even if the targeting was specific.
Things like engagement, shares, comments from users will actually bring a lot of future value to the brand. Because a guy who shared an ad might go to the brand store and purchase after some time. We have to understand that not every people buy instantly. I always track sales and conversion as a metric only when the objective of the campaign is to get a lead or a direct ROI. But in most cases, many brands (which have succeeded with Facebook ads) tend to implement a funnel path and there we would first have to track the cost per engagement, likes, etc. And tracking cost per link can be helpful in case of remarketing campaigns (where brands want to attract returning traffic to grow sales) or even a traffic objective campaign.